read
Google Analytics has long been the go-to platform for digital marketers seeking to measure and optimise their online campaigns. With the introduction of the new Google Analytics 4 (GA4), a new era of analytics has emerged, offering a significant upgrade from its predecessor, Universal Analytics (UA). As a digital marketer, it's essential to understand the differences between these two platforms and adapt to the changes brought by GA4 in order to stay ahead of the game and enjoy the benefits.
Adapting to GA4 reporting is crucial for digital marketers, as Google will eventually phase out every Universal Analytics property. By familiarising yourself with the new platform and its reporting capabilities, digital marketers can leverage the advanced features of Google Analytics reports to make more informed decisions, optimise their campaigns, and maximise their return on investment.Transitioning your Google Analytics account to GA4 might seem overwhelming at first, but with a thorough understanding of its benefits and functionalities, digital marketers can unlock new opportunities and thrive in this new era of analytics.
How Do You Navigate Google Analytics Reports?
In GA4, the navigation experience has been revamped to provide a more streamlined and user-friendly approach to accessing reports. Unlike Universal Analytics, which had a left-hand side menu for report navigation, GA4's report navigation is primarily through the "Overview" section. Here, digital marketers can quickly access specific report widgets and dive into the data they need.
Delving into Lifecycle and User Reports
GA4 organises its reports into two broad categories: Lifecycle and User reports. Understanding these categories will make it easier for digital marketers to create Google Analytics reports quickly and efficiently.
Lifecycle Reports: These reports focus on the various stages of a user's journey on your website or app. They provide insights into aspects such as user acquisition, engagement, and retention, allowing you to better understand and optimise your marketing efforts.
User Reports: User behavior reports give you detailed information about the characteristics of your active users, such as their demographics, location, and the devices they use. This user activity and demographic data can be instrumental in tailoring your marketing strategies to better target your audience.
Comparing reports in Google Analytics 4 and Universal Analytics
The transition from Universal Analytics to GA4 might seem daunting, but understanding the differences in their reporting navigation can help digital marketers adapt to the new platform with ease. Here's a comparison of the reporting navigation in GA4 and Universal Analytics:
Universal Analytics: Reports were easily accessible through a menu on the left-hand side of the platform. This menu featured predefined reports that allowed users to quickly access information about their website's performance.
GA4: Reports are now primarily accessed through the "Overview" section, which features various report widgets. Although GA4 offers fewer predefined reports than Universal Analytics, it boasts a more flexible way to create a new custom report with the website data you want. Users can create their own reports based on their specific needs, allowing for a more tailored and relevant analysis of their data.
Customising your reports to meet your needs is how you can integrate Google Analytics data into your business and workflow. For example, you can:
Customise a "Top Traffic Sources" report by applying a filter for a specific subdomain.
Create a "Mobile Traffic" report by filtering device categories to only display mobile data.
Generate a "Site Search Terms" report, focusing on the search term dimension and event count metrics.
Understanding User Reports in GA4 vs Universal Analytics
User reports in GA4 have evolved from their Universal Analytics counterparts, offering a more comprehensive and customizable view of your audience. While Universal Analytics provides separate reports for audience, acquisition, and behaviour, GA4 combines these dimensions to present a more holistic picture of your users.
Equivalent Reports in GA4: User Characteristics, Location, Devices, and Demographics
Digital marketers familiar with Universal Analytics may initially struggle to find equivalent reports in GA4. To ease the transition, we've compiled a list of GA4 reports that correspond to the most commonly used user reports in Universal Analytics:
User Characteristics
Universal Analytics: Audience > Demographics > Overview
GA4: User reports > Demographics
Location
Universal Analytics: Audience > Geo > Location
GA4: User reports > Geography
Devices
Universal Analytics: Audience > Technology > Browser & OS or Audience > Mobile > Devices
GA4: User reports > Technology
Demographics
Universal Analytics: Audience > Demographics > Age or Audience > Demographics > Gender
GA4: User reports > Demographics > Age and Gender
Tips for Finding Specific User Reports in GA4
As you navigate the GA4 platform, it's important to know how to locate specific user reports efficiently. Here are some tips to help you find the data you need:
Utilise the on-site search functions: GA4's search bar, located at the top of the interface, is a powerful tool for quickly finding specific reports. Simply type in keywords related to the report you're looking for, and GA4 will present relevant results.
Create custom reports: If you can't find a specific report in GA4, consider creating a custom report tailored to your needs. GA4's Exploration Reports allow you to build custom reports by selecting dimensions and metrics relevant to your analysis.
Explore GA4's comprehensive report library: Familiarise yourself with GA4's extensive list of user reports, which include:
Demographics: Gain insights into the age, gender, and interests of your users.
Geography: Learn about the geographic location of your users, including country, region, and city data.
Technology: Analyse the devices, browsers, and operating systems used by your audience.
Traffic Acquisition: Understand how users are finding your website or app, and which channels are driving the most engagement.
Leverage GA4's enhanced filtering and segmentation: Use GA4's advanced filtering and segmentation options to narrow down your data and focus on the user groups that matter most to your business.
Acquisition Reports in GA4: Harnessing the Power of Data for Customer Acquisition
In GA4, traffic analysis and channel performance are essential elements in understanding how users discover and engage with your online content. GA4 presents a unified view of user acquisition, allowing you to identify the channels driving the most traffic and conversions.
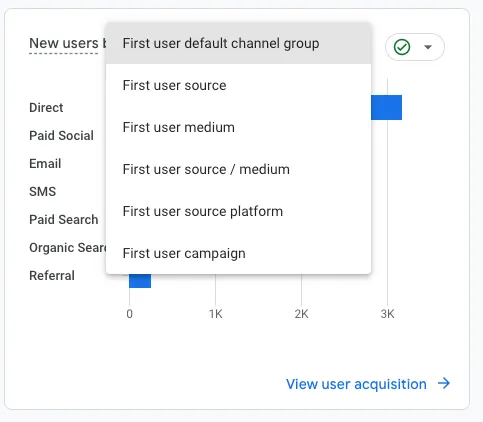
User Acquisition and User Acquisition: First User Medium
GA4 introduces two new reports that provide a more granular view of your acquisition data:
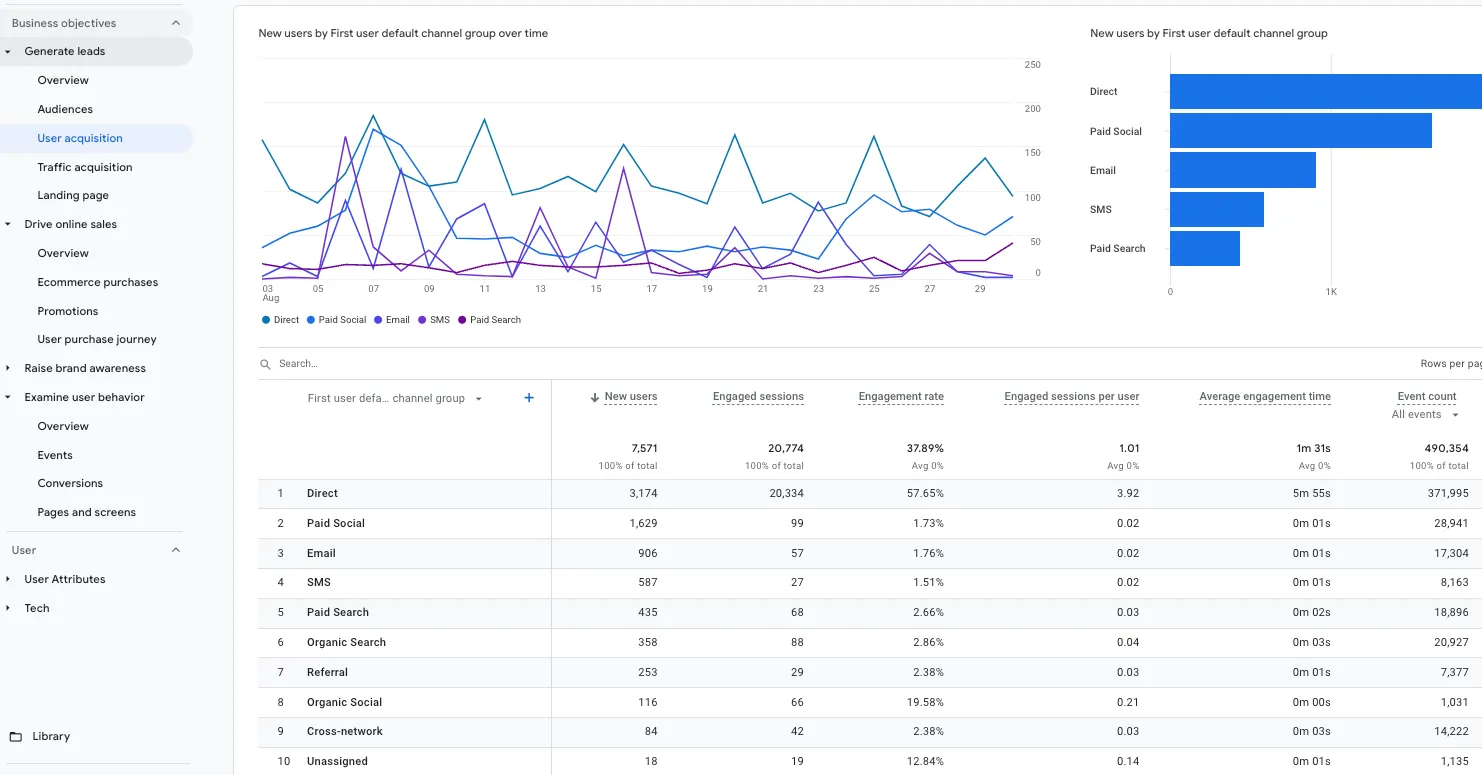
User Acquisition: This report offers a high-level view of user engagement, highlighting the number of new users, their sources, and their engagement metrics such as sessions, events, and revenue generated. You can also analyse traffic by channel, source, and medium.
First User Medium: This report dives deeper into acquisition data by focusing on the first medium through which users interacted with your website or app. This information is invaluable in determining the initial touchpoints that attract users and identifying which channels are most effective in driving long-term engagement.
Comparing Acquisition Reports in GA4 vs Universal Analytics
As GA4 introduces new reports and features, it's essential to understand how these compare with their Universal Analytics counterparts. Additionally, it's equally important to clarify whether we're looking to analyse traffic or user data, as this will influence our choice of reports. With this in mind, here's a brief comparison of key acquisition reports in both platforms:
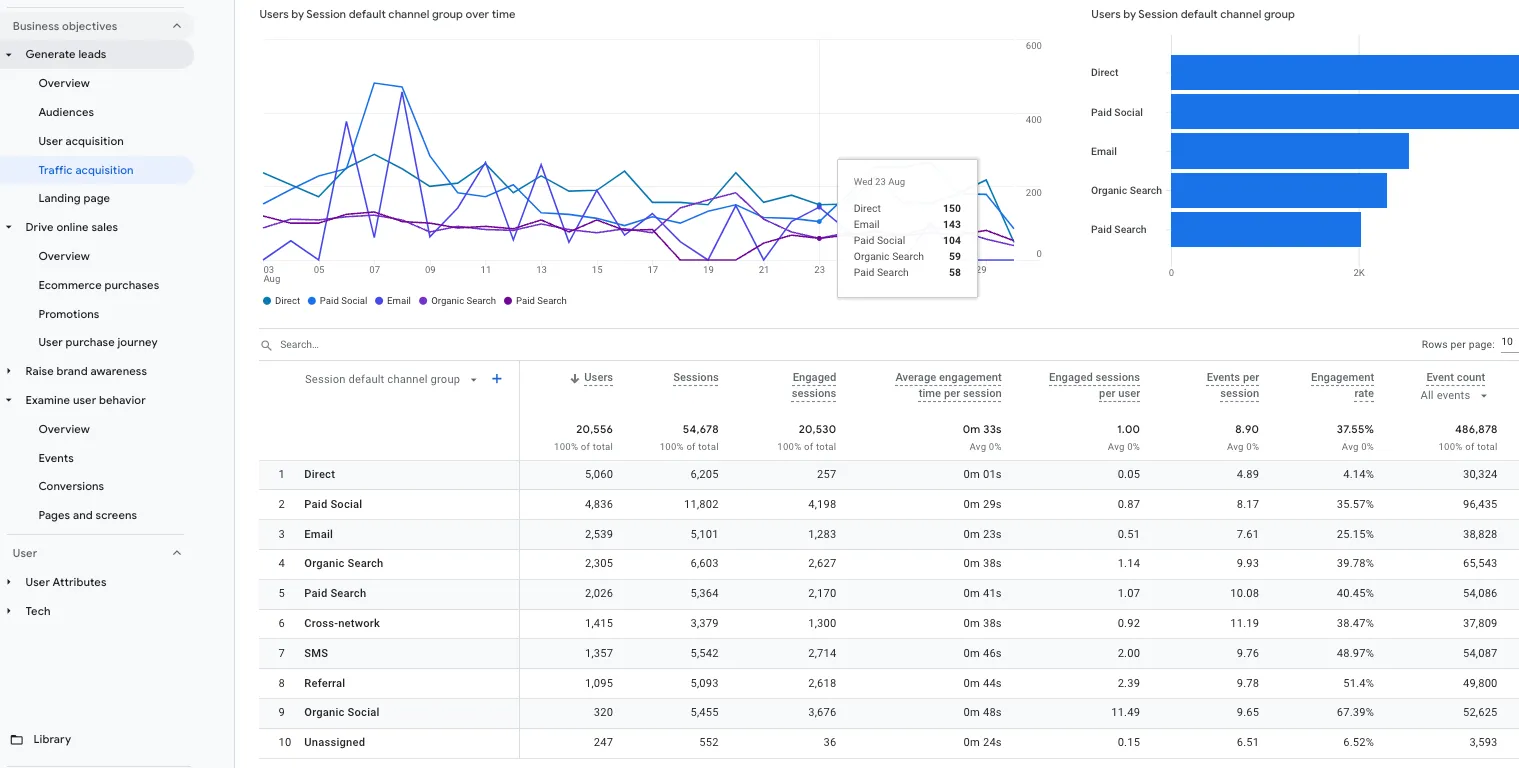
Channels
Universal Analytics: Acquisition > All Traffic > Channels
GA4: Acquisition > Traffic Acquisition > Channels
Source/Medium
Universal Analytics: Acquisition > All Traffic > Source/Medium
GA4: Acquisition > Traffic Acquisition > Source and Medium
Referrals
Universal Analytics: Acquisition > All Traffic > Referrals
GA4: Acquisition > Traffic Acquisition > Referrals
Organic Search
Universal Analytics: Acquisition > All Traffic > Organic Search
GA4: Acquisition > Traffic Acquisition > Organic Search
IMPORTANTBy understanding these differences, and identifying whether you're focusing on user or traffic data, you can more easily adapt your acquisition analysis strategies to GA4's new reporting framework.
Strategies for Effective Customer Acquisition Campaigns
To make the most of GA4's acquisition reports, consider implementing the following strategies:
Identify high-performing channels: Use the User Acquisition report to pinpoint the channels that are driving the most traffic, conversions, and revenue for your business. This information can help you allocate resources more effectively and refine your marketing strategies.
Evaluate first touchpoints: Analyse the User Acquisition: First User Medium report to determine the initial channels through which users discover your content. This will help you optimise your marketing campaigns to target the most effective channels for attracting new users.
Monitor referral traffic: Keep an eye on the Referrals report to identify the websites and platforms that are driving the most referral traffic to your site. Cultivate partnerships and collaborations with these referrers to maximise the benefits of these relationships.
Optimize search engine performance: Regularly review the Organic Search report to monitor the performance of your SEO efforts. Identify the keywords that are driving the most search traffic and conversions, and optimise your content to improve visibility in search results.
Engagements Reports in GA4: Unlocking the Secrets of User Engagement
Behaviour reports in GA4 provide valuable insights into how users interact with your website or app. These reports allow you to track user engagement, monitor key events, and understand the effectiveness of your content. By leveraging the data from behaviour reports, you can optimise your website or app to deliver a better user experience and improve conversions.
Differences Between GA4 and Universal Analytics Engagement Reports
While both GA4 and Universal Analytics offer behaviour reports, there are several differences between the two platforms. Here's a brief comparison of the key features:
Events: GA4 focuses on event-based tracking, offering a more granular view of user interactions. Universal Analytics, on the other hand, relies on pageview tracking and session-based metrics.
Customization: GA4 allows you to define custom events and parameters, giving you greater control over the data you collect. Universal Analytics uses predefined categories, actions, and labels for tracking events.
Automatic Event Tracking: GA4 automatically tracks certain events, such as scrolls and clicks, without requiring additional code. In Universal Analytics, you need to implement custom event tracking manually.
Enhanced Measurement: GA4 offers enhanced measurement capabilities, enabling you to track user interactions with built-in event tracking for video, file downloads, and outbound clicks. Universal Analytics requires manual setup for similar functionality.
Locating Common Engagement Reports in GA4
To help you navigate the engagement reports in GA4, here are some common reports and their locations in the GA4 interface:
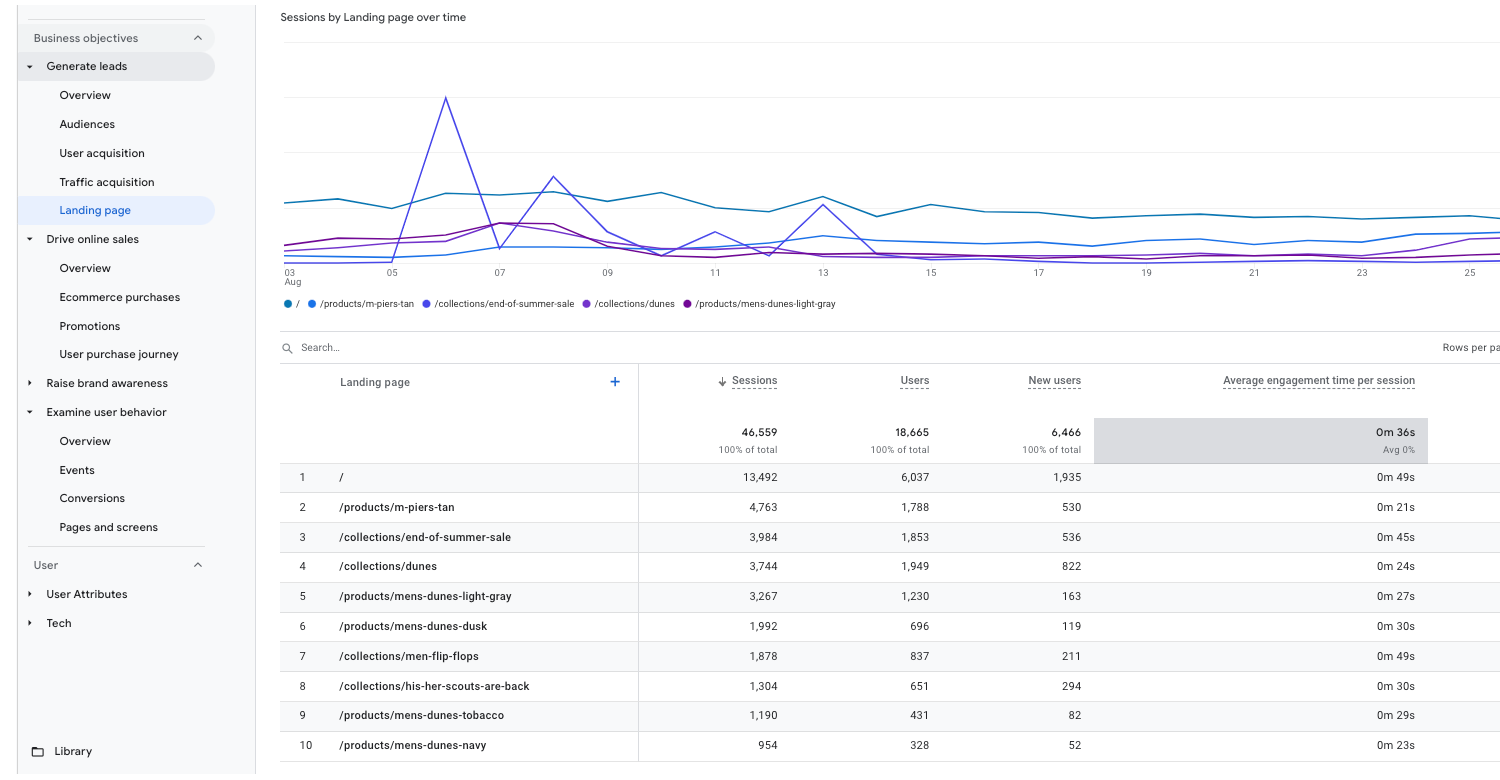
4. Landing page:The Landing Pages report is located under Engagement > Landing Pages. This report provides data on the first page a user visits during a session on your website or app. It helps you understand the effectiveness of your landing pages in attracting and retaining users. With this report, you can see the bounce rate, average session duration, and conversions for each landing page, allowing you to identify which pages are performing well and which may need further optimization.
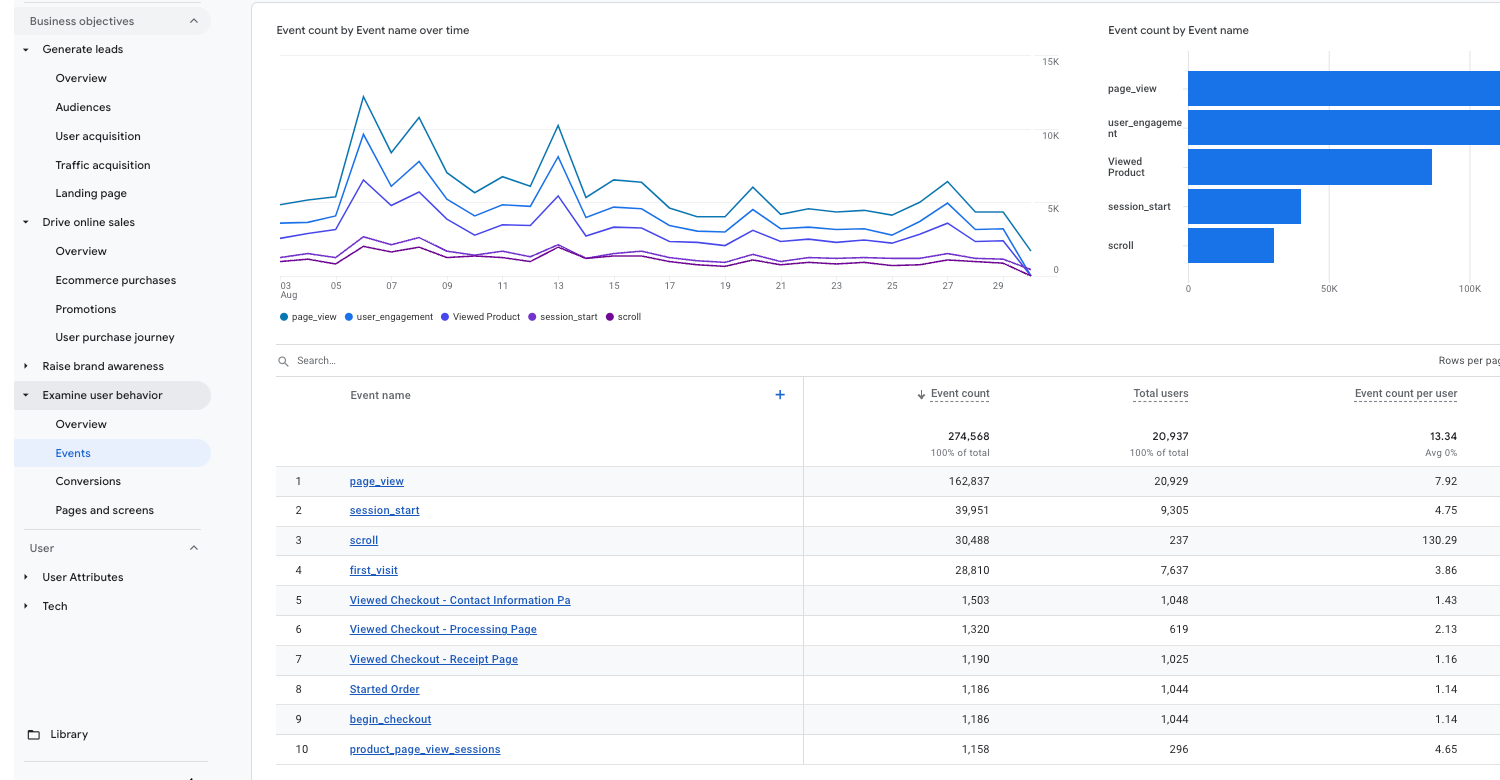
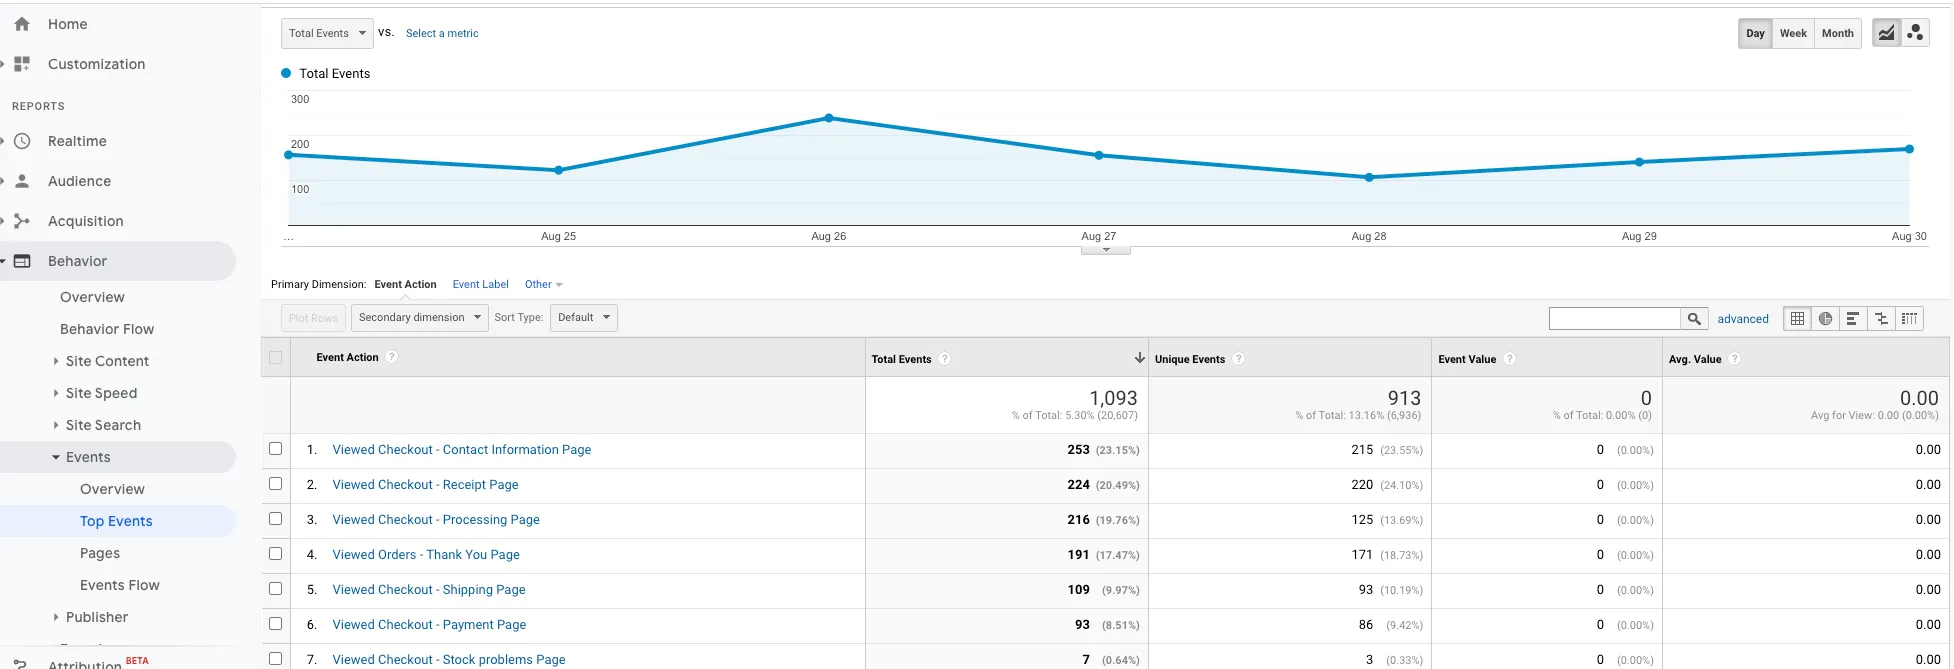
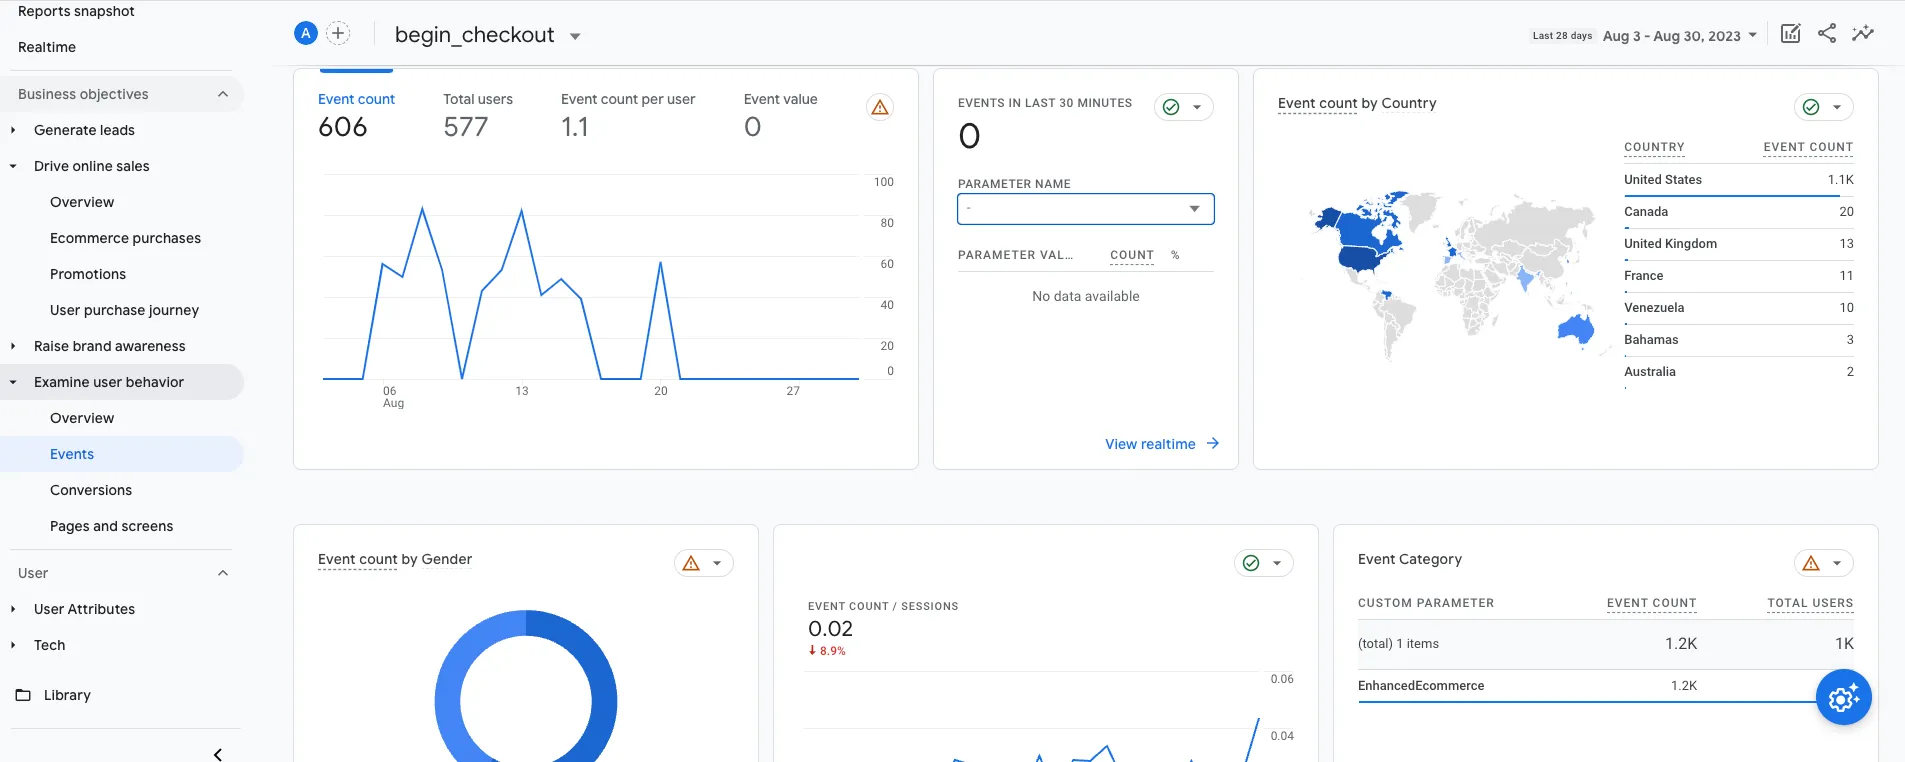
1. Events: Access the Events report by navigating to Engagement > Events. This report provides an overview of the most common events on your website or app, such as page views, button clicks, and video plays. You can also create custom events and analyse their performance in this report.
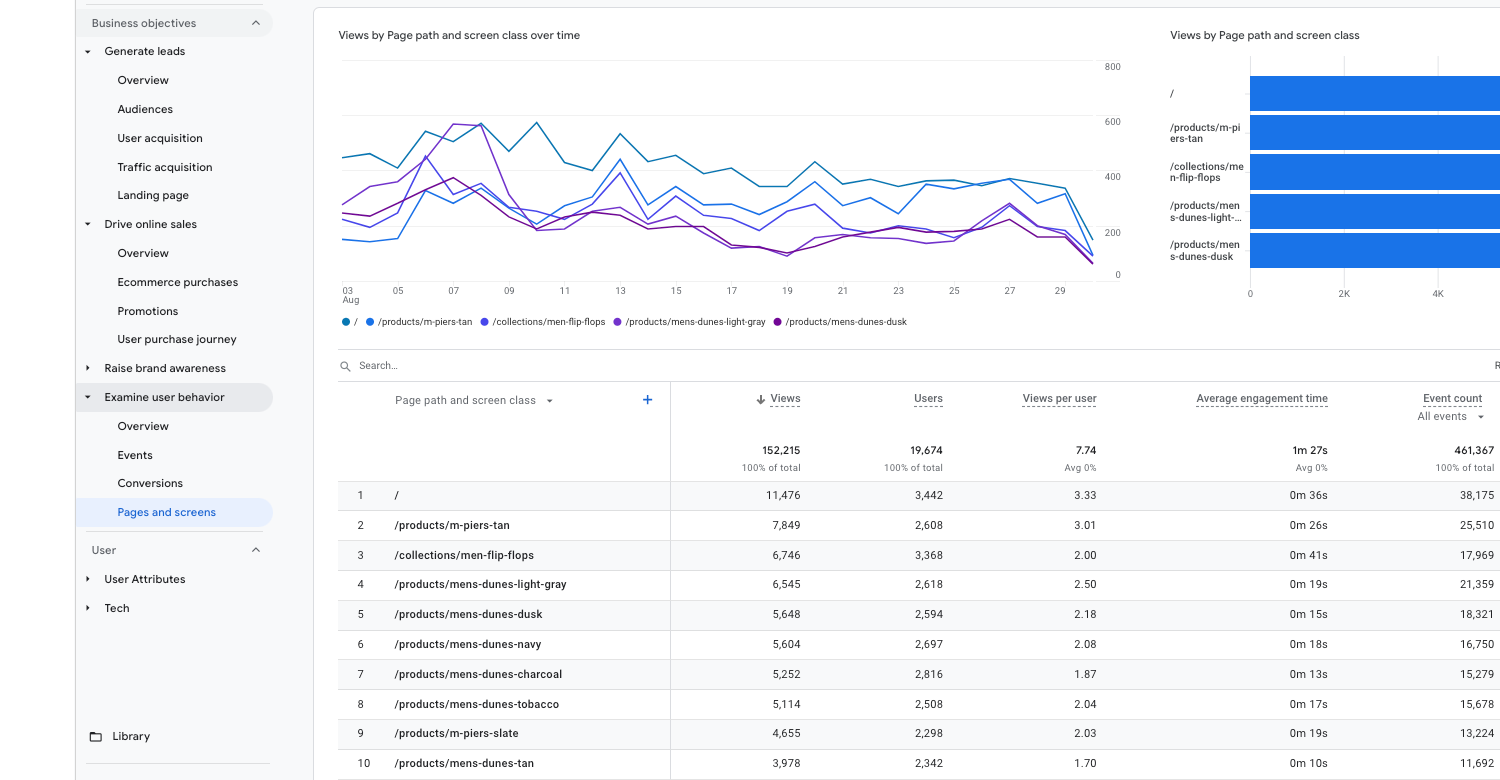
2. Pages and Screens: Find the Pages and Screens report by going to Engagement > Pages and Screens. This report shows the most popular pages and screens on your website or app, giving you an understanding of the content that resonates with your audience. Use this report to identify areas for improvement and optimization.
Tracking Conversions in GA4 vs Universal Analytics
Conversions, a critical aspect of any digital marketing campaign, represent the desired actions taken by users on your website or app. Both GA4 and Universal Analytics track conversions, but the approach and features differ significantly:
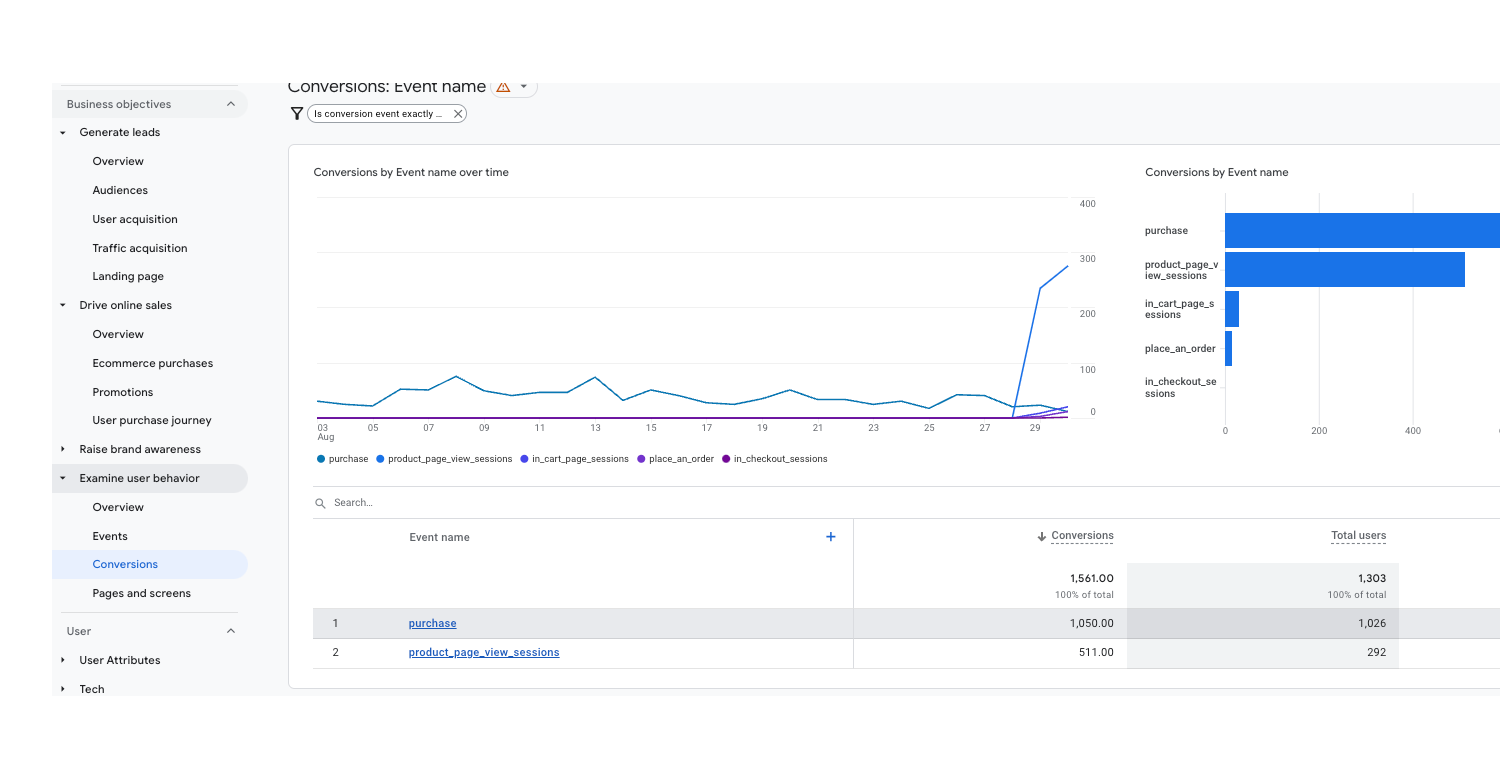
Events and Goals: In GA4, conversions are tracked through events, while Universal Analytics uses goals. GA4 provides a more flexible and customizable approach to conversion tracking with events, offering better insights into user actions.
Custom Events: GA4 allows you to create custom events to track specific user actions, whereas Universal Analytics requires you to define goals based on pre-existing event categories, actions, and labels.
Conversion Attribution: GA4 employs data-driven attribution models, providing more accurate insights into the channels and touchpoints driving conversions. Universal Analytics uses rule-based attribution models, which may not always reflect the true impact of your marketing efforts.
Claim Your Free Audit to Uncover Hidden Opportunities
Analysing Ecommerce and In-app Purchase Metrics in GA4
Google Analytics 4 offers robust tools to delve into your ecommerce and in-app purchase data. Here are some ways to harness the power of GA4's Monetization reports:
Ecommerce Purchases: Under the Monetization section, head over to the "Ecommerce Purchases" report. This report provides an in-depth look at your ecommerce performance, showing total purchases, purchase revenue, and average purchase revenue. Use this data to get a comprehensive view of your overall ecommerce performance and identify trends and patterns over time.
User Purchase Journey: Understanding your users' purchase journey is crucial for optimising your sales funnel. In GA4, you can leverage the "Funnels" tool in the Explorations workspace to visualise this journey. Start by setting your funnel steps that correspond to the user's path to purchase, from product view to checkout completion. This analysis can reveal potential bottlenecks in your ecommerce process, paving the way for strategic improvements. An assisted conversions report can also help evaluate which parts of your funnel are most effective.
In-App Purchases: If you have an app, you'll want to keep an eye on the "In-app purchases" report in the Monetization section. This report gives you a breakdown of the total in-app purchases, purchase revenue, and average revenue per purchase. Monitor these metrics to understand how well your in-app purchase strategy is working and where there might be opportunities to enhance your revenue.
Compare Attribution Models: Attribution models aren't just for conversions. They're equally important when analysing ecommerce and in-app purchase data. Use GA4's attribution models to understand the impact of different marketing channels and touchpoints on your ecommerce and in-app purchases. This insight can help you optimise your marketing efforts and resource allocation for better ROI.
Remember, GA4 provides you with powerful, customizable reporting tools to gain deep insights into your ecommerce and in-app purchase data. Spend time familiarising yourself with these features, and don't hesitate to experiment with different configurations to get the most valuable insights for your business.

Elevating Ecommerce and Multi Channel Funnel Reports in GA4: Unlocking the Full Potential
GA4 offers enhanced ecommerce reporting capabilities that provide a comprehensive view of your online store's performance. Key features of ecommerce reporting in GA4 include:
Enhanced Measurement: GA4 can track essential ecommerce events, such as view_item, add_to_cart, and purchase, without requiring additional manual configuration.
Customizable Ecommerce Events: Create custom ecommerce events to track specific user actions, such as product interactions, cart updates, and checkout steps, providing deeper insights into user behaviour.
Ecommerce Overview: GA4's Monetization > Overview report offers a comprehensive view of your ecommerce performance, including revenue, transactions, average order value, and more.
Product Performance: Analyse individual product performance through the Monetization > Items report, including metrics like items sold, revenue generated, and item conversion rate.
Multi Channel Funnel Reporting in GA4
GA4 introduces advanced cross channel data measurement and reporting, enabling you to understand the customer journey and the role of different marketing channels in driving conversions. You'll want to use this to replace some of the functions of the old navigation summary report as well. Key features of GA4's multi channel funnel reporting include:
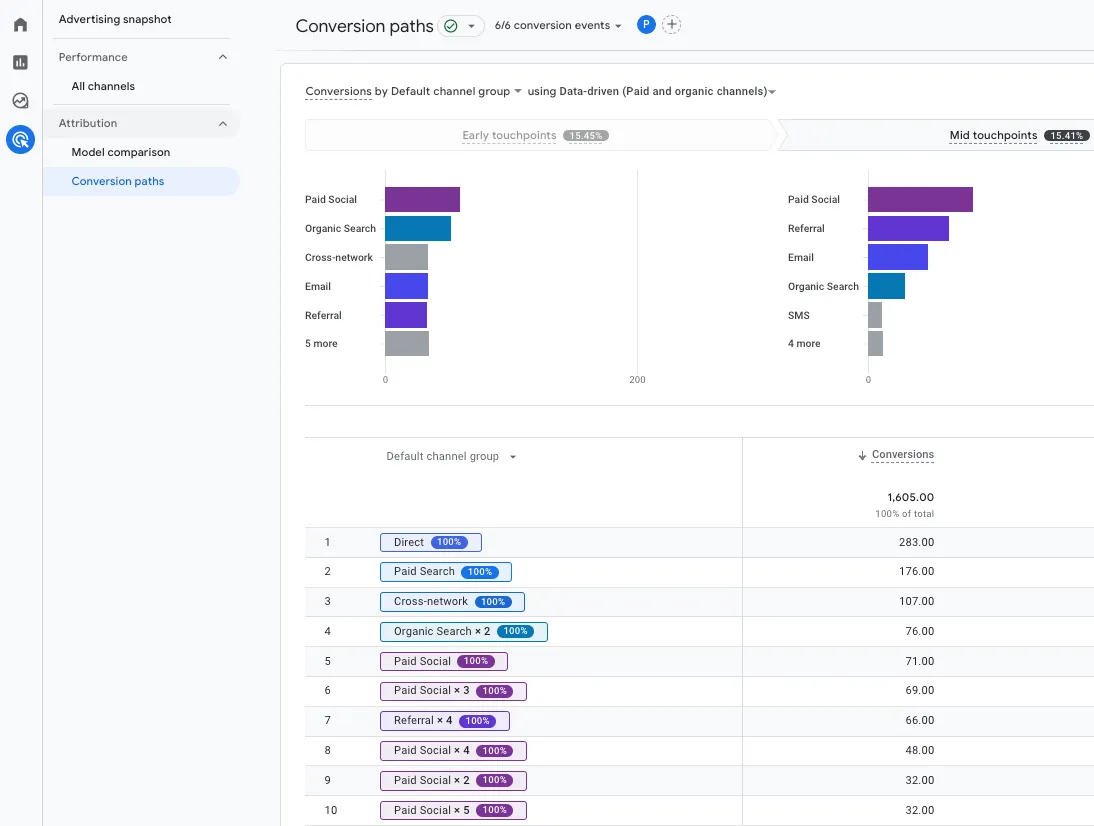
Path Analysis: GA4's Path Analysis report (located in Exploration > Analysis Hub > Path analysis) provides a visual representation of the user journey, showcasing the sequence of user actions and touchpoints leading to conversions.
Conversion Paths: The Conversion Paths report reveals the different touchpoints and channels users interacted with before converting, offering insights into the effectiveness of your marketing efforts across various channels.
Data-driven Attribution: GA4 uses data-driven attribution models to accurately attribute conversions to the most influential channels and touchpoints, helping you optimise your marketing strategy and resource allocation.
Comparing Ecommerce and Multi Channel Funnel Reports in GA4 vs Universal Analytics
There are notable differences between GA4 and Universal Analytics when it comes to ecommerce and multichannel funnel and app data reporting:
Customizable Ecommerce Events: GA4 offers a more flexible approach to ecommerce tracking by allowing custom events, whereas Universal Analytics relies on predefined event categories and actions.
Path Analysis: GA4's Path Analysis report provides a more detailed and customizable view of user journeys compared to Universal Analytics' Top Conversion Paths report.
Attribution Models: GA4 utilises data-driven attribution models for more accurate insights, while Universal Analytics relies on rule-based attribution models, which may not always reflect the true impact of your marketing efforts.
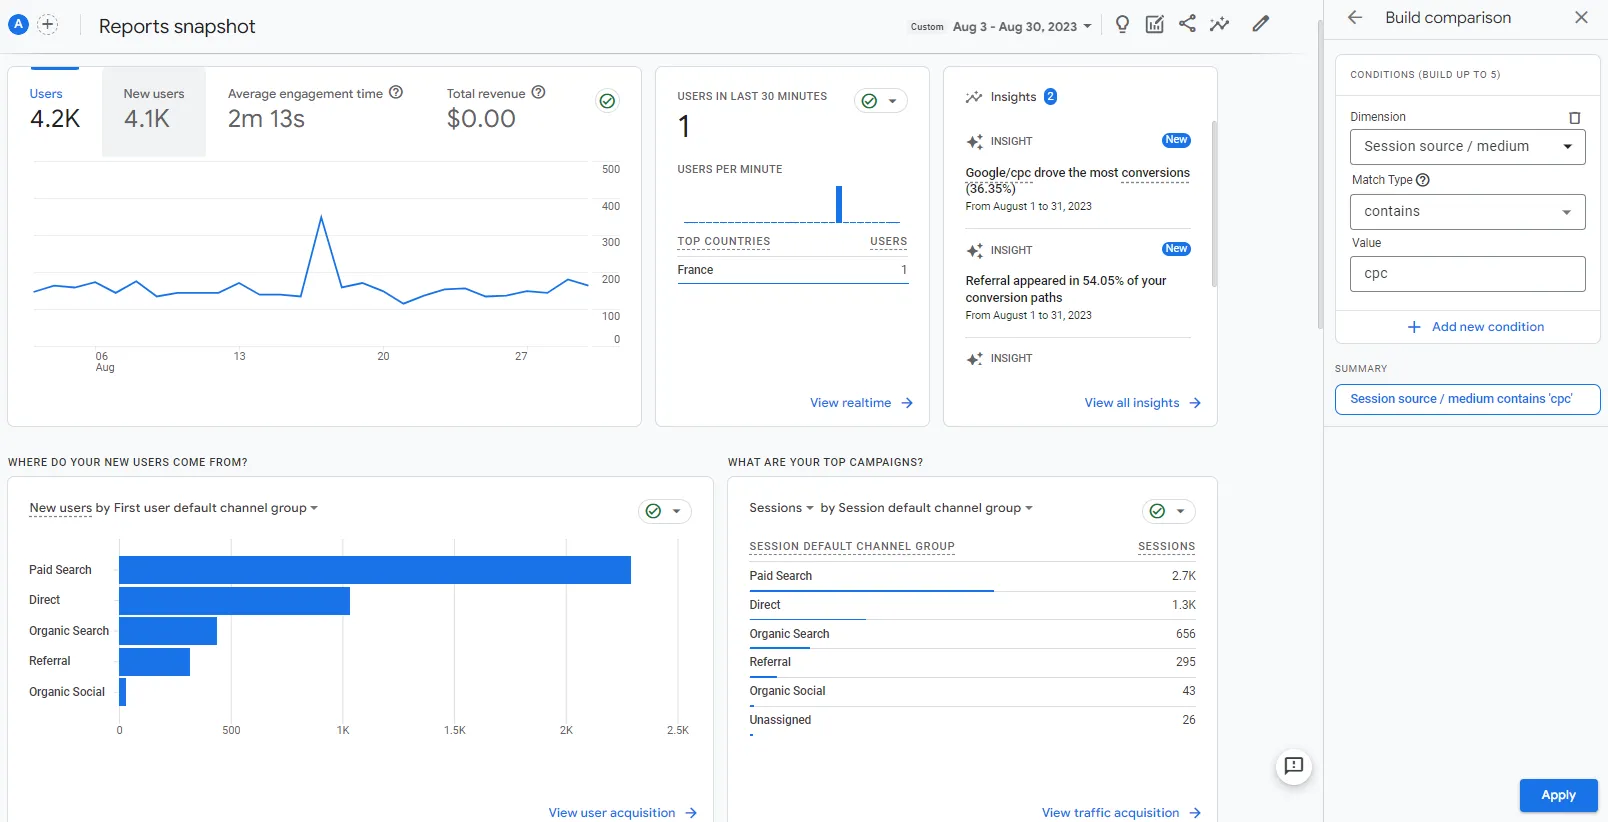
Advanced GA4 Reporting: Unlock Insights with Comparisons, Filters, and Segments
GA4 offers advanced filtering and comparison options to help you refine and customise your data analysis. By applying filters, you can focus on specific subsets of data or exclude irrelevant data points. Comparisons, on the other hand, enable you to analyse differences between data sets or time periods.
Filters: Apply filters in GA4 by clicking on the 'Filter' icon in the top-right corner of a report. Select the dimension or metric to filter, choose the operator, and specify the value or range. You can apply multiple filters to create complex data queries.
Comparisons: To use comparisons, click on the 'Add Comparison' button in the top-right corner of a report. Choose the dimension or metric, the operator, and the value or range. You can compare up to five datasets simultaneously.
Deep Diving and Interrogating Data Using Comparisons
Comparisons in GA4 enable you to conduct in-depth analysis of your data by contrasting different segments, time periods, or user behaviours. This allows you to:
Identify Trends: Compare data over different time periods to spot emerging trends or seasonal variations in your website traffic, user behaviour, or conversion rates.
Evaluate Marketing Campaigns: Contrast the performance of different marketing channels, campaigns, or ad creatives to determine which are driving the most traffic, engagement, or conversions.
Analyse User Segments: Compare user segments based on demographic information, location, device type, or user behaviour to gain insights into how different groups interact with your website or app.
Tips for Spotting Opportunities and Trends in GA4
To uncover valuable insights, opportunities, and trends in GA4, consider the following tips:
Combine Filters and Comparisons: Utilise both filters and comparisons to isolate specific data points or segments for detailed analysis, revealing hidden opportunities or trends.
Utilise Custom Reports: Create custom reports in GA4's Exploration Reports to analyse data with greater granularity, enabling you to identify patterns or anomalies that may warrant further investigation.
Monitor Key Metrics: Regularly monitor and analyse key performance indicators (KPIs) like traffic sources, user engagement, conversion rates, and revenue to identify trends and optimise your marketing strategy.
Stay Alert: Set up custom alerts in GA4 to notify you when significant changes occur in your data, such as a sudden increase in traffic or a drop in conversions, allowing you to take prompt action.
Exploration Reports
In this section, we're going to unpack one of the most versatile tools of GA4 reporting: the Exploration Reports. From gaining deeper insights to customising your very own dashboards, Exploration Reports are your master key to understanding user behaviour on your website or mobile app.
Insights
Exploration Reports in GA4 serve as an advanced tool for analysing user behaviour and customer journeys in detail. They empower you to go beyond standard reports and dig deeper into your data, providing richer insights into your website or app's performance. These reports support a variety of analytical techniques such as:
Free-form exploration: Explore your data using different visualisation styles like bar charts, pie charts, line charts, scatter plots, and geo maps.
Cohort exploration: Gain insights from the behaviour and performance of groups of users related by common attributes.
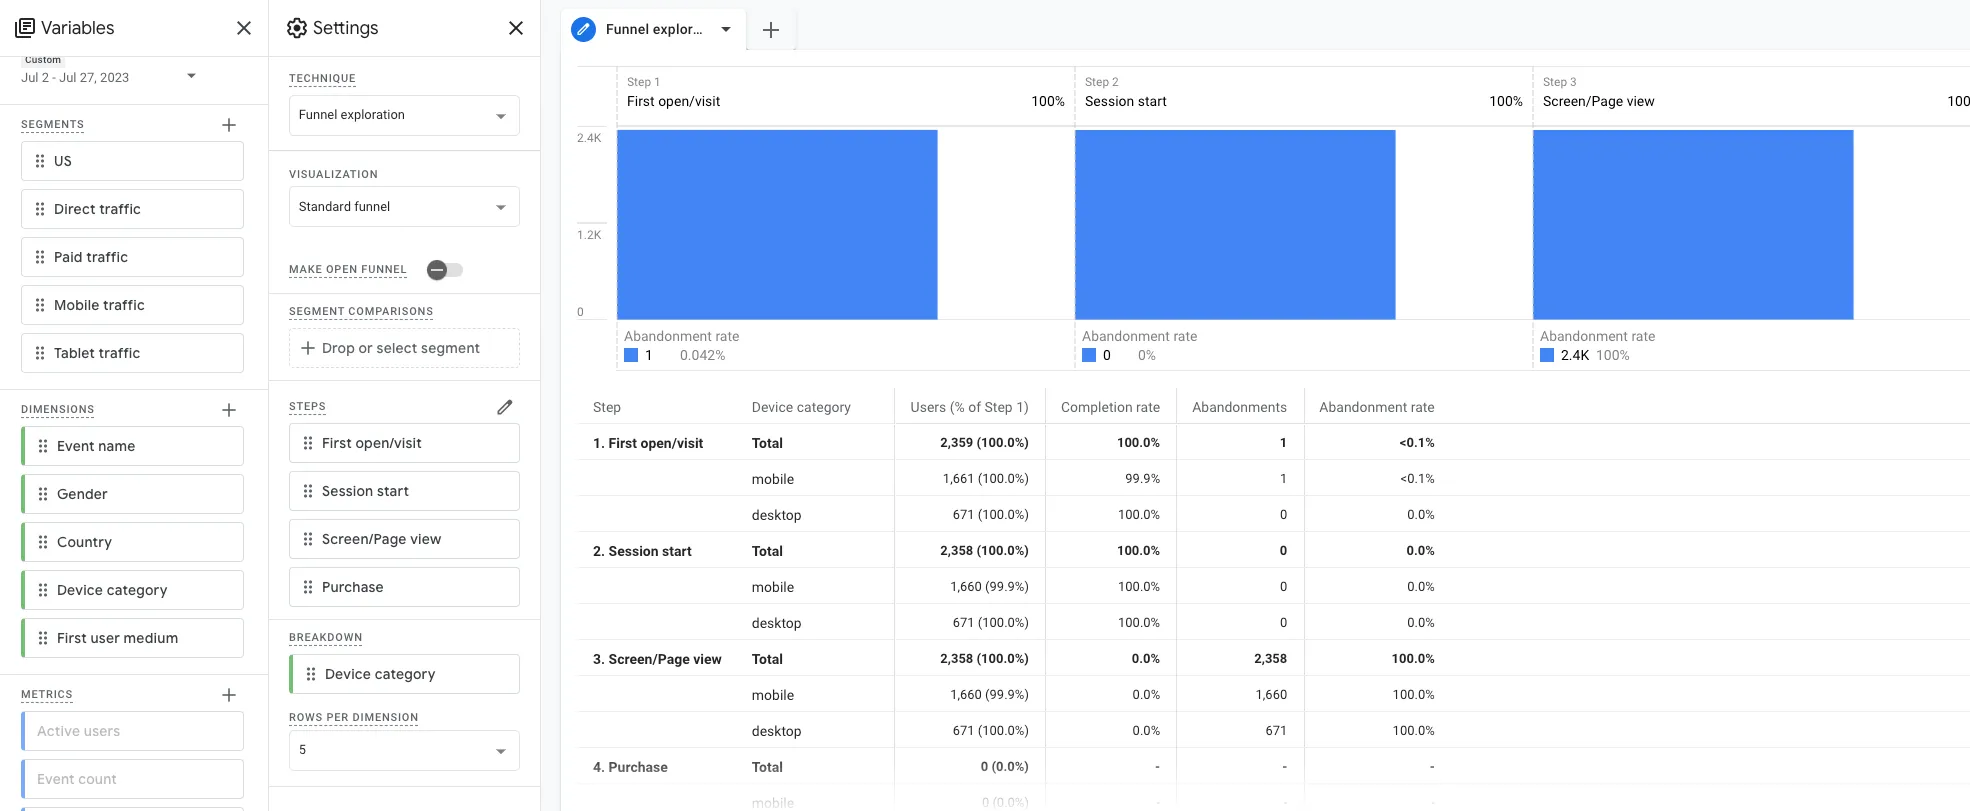
Funnel exploration: Visualise the steps users take to complete tasks on your site or app, helping you optimise user experience and identify over- or under-performing audiences.
Segment overlap: See how different user segments relate to each other and identify new segments of users who meet complex criteria.
User exploration: Examine the users that make up the segments you create or import and drill down into individual user activities.
Path exploration: Visualise the paths your users take as they interact with your website and app.
User lifetime: Explore user behaviour and value over their lifetime as a customer.
Dashboard
The Exploration Reports feature an interactive dashboard divided into three main sections: Canvas, Variables, and Tab Settings.
Canvas: This is the large area on the right that displays your data using the selected technique. The canvas can have multiple tabs, allowing you to use multiple techniques in a single exploration.
Variables: The panel on the left gives you access to the dimensions, metrics, and segments you can use in the exploration. You can also change the timeframe of the exploration in the Variables panel.
Tab Settings: This panel allows you to configure the currently selected tab. You can select the technique, add items from the Variables panel, and configure technique-specific options.
Accessing the Exploration Reports is straightforward. Simply click "Explore" in the left-hand navigation menu of your GA4 property.
Master-Level
Mastering the Exploration Reports requires a deep understanding of the Variables and Tab Settings, as these allow for the customization of your analysis.
PRO TIPIn the Variables tab, you can set the date range, choose which segments of users you want to include in your analysis, and select the desired dimensions and metrics for your data. The Tab Settings tab is where you specify the technique you want to use for your exploration. Each technique has a unique purpose and provides a different way to analyse your data. Selecting the right technique for your analysis is crucial for obtaining the most meaningful insights.
Conclusion
In summary, Google Analytics 4 offers a wealth of advanced reporting features, allowing digital marketers to dive deep into their data and uncover valuable insights. By effectively navigating and utilising GA4's User, Acquisition, Behavior, Conversion, Ecommerce, and Multi Channel Funnel Reports, as well as mastering the application of filters, comparisons, and segments, you can optimise your marketing strategy and drive better results.
However, understanding and implementing these advanced features can be a challenging task, especially for those new to GA4. That's where Optimum Click comes in. As a UK-based full-service digital marketing agency, Optimum Click specialises in data-driven decision-making and offers a comprehensive data analysis service to help you unlock the full potential of GA4.
Don't let GA4's advanced features overwhelm you – contact Optimum Click today and discover how our expertise can help you harness the power of Google Analytics 4 to propel your marketing strategy to new heights.
Claim Your Free Audit to Uncover Hidden Opportunities
FAQ
Share this article!
Author of the article

GÁBOR Cseh
PPC Expert & Data Analyst
Author of the article
Family-man Gabor is in it for the long run. Whether that’s in sport, with his Garmin watch tracking every metre, every kilometre, or in business, where his long term digital marketing strategies shape ongoing online success over months and years.
For Gabor - success all about the journey.
9 years experience in online marketing
Google Ads (Search, Shopping, Display, YouTube)
Google Analytics
Google Tagmanager
Data Studio
Facebook and LinkedIn Ads